
Why Earned Value Management (EVM) remains one of the best project control techniques.
Introduction: The necessity of data-driven project management
In complex projects – construction, aerospace, defence, IT and infrastructure – cost overruns and schedule delays are frequent risks. Traditional methods of budget tracking and schedule reporting often fail because they measure what has been spent and what has been achieved separately, without linking them together.
This is where the Earned value management (EVM) it stands out. Unlike simple cost tracking, EVM offers an integrated view of scope, schedule, and cost performance within a single framework.
The EVM allows project managers to quantify performance, anticipate future trends, and take proactive corrective actions. Despite its demonstrated value, many organisations still encounter difficulties in its effective implementation.
This article offers a detailed and high-value analysis of the EVM, including:
✅ Key indicators and formulas of EVM
✅ How to apply EVM to real-world projects
✅ Case studies from the industry
✅ Challenges and best practices for successful EVM implementation
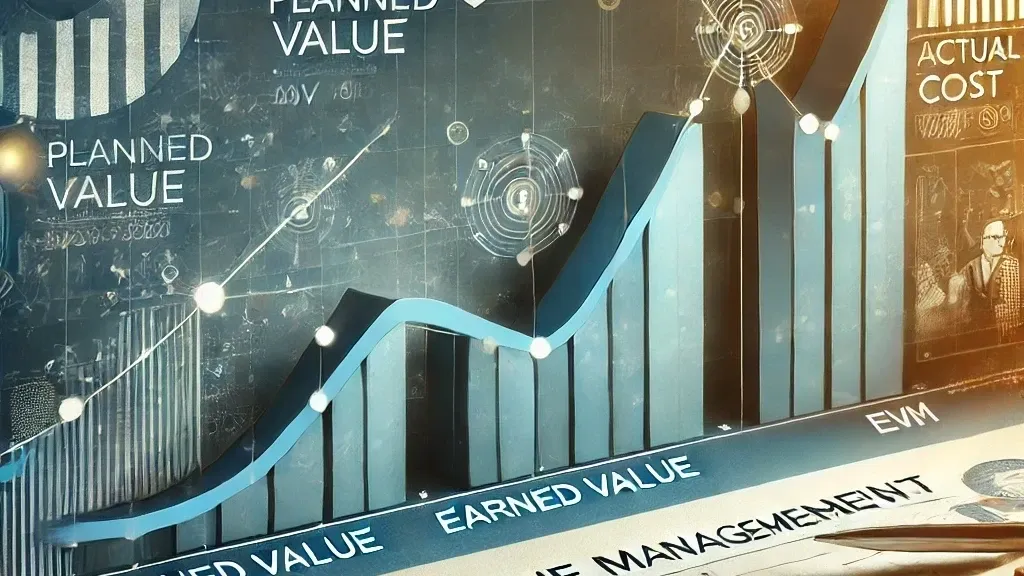
What is Earned Value Management (EVM)?
Definition
EVM is a quantitative project management technique that integrates:
Planned work (which must be achieved)
The work actually completed (which has been done)
Costs incurred (which was spent)
By comparing these three dimensions, EVM provides an accurate and real-time view of the project's health.
Main advantages of the EVM:
Anticipate cost overruns before they occur
Identify real-time schedule delays
Improve decision-making with objective data
Financial reporting and operational monitoring are closely linked as both provide crucial insights into a company's performance and health. Financial reporting focuses on historical data, presenting a company's financial position, results of operations, and cash flows in a standardized format. This includes statements like the balance sheet, income statement, and cash flow statement, which are typically prepared at regular intervals (quarterly, annually) for external stakeholders such as investors, creditors, and regulators. Operational monitoring, on the other hand, deals with real-time or near real-time data related to the day-to-day activities of the business. It tracks key performance indicators (KPIs) that measure efficiency, productivity, quality, and other operational aspects. Examples include sales figures, production output, customer service response times, inventory levels, and project completion rates. The link between them is that: * **Operational Data Feeds Financial Reporting:** The operational activities measured through monitoring directly impact the financial results. For example, increased sales (operational KPI) lead to higher revenue (financial reporting item). Decreased production efficiency (operational KPI) might result in higher cost of goods sold (financial reporting item) and lower profit margins. Therefore, operational data provides the underlying substance for the financial figures. * **Financial Reporting Validates Operational Performance:** Financial reports offer a high-level, aggregated view that can validate or challenge the trends observed in operational monitoring. If operational reports show increasing sales, the financial statements should reflect this with higher revenue. Conversely, if financial reports indicate declining profitability, operational monitoring can help pinpoint the areas of inefficiency or underperformance that are causing the issue. * **Information Flow for Decision-Making:** Both are essential for effective management. Operational monitoring allows managers to make timely adjustments to processes to improve efficiency and achieve targets. Financial reporting provides a broader perspective for strategic decision-making, investment planning, and assessing overall business strategy. Managers use financial reports to understand the financial consequences of operational decisions and to set future operational goals that align with financial objectives. * **Performance Management:** Together, they form a complete performance management system. Operational monitoring provides the detailed "how" and "why" behind the financial outcomes reported. Financial reporting provides the "what" – the ultimate financial impact. This integrated view helps in setting realistic targets, evaluating performance against those targets, and implementing corrective actions. In essence, operational monitoring provides the granular, real-time insights into *how* the business is performing day-to-day, while financial reporting aggregates this information into a structured, historical view of the business's financial health and performance. They are complementary, with each informing and validating the other to provide a holistic understanding of business success.
2. Key Performance Indicators (KPIs) and EVM Formulas
The EVM is based on a set of performance indicators for measuring project progress.
Understanding CPI and SPI: The Two Key Indicators
CPI (Cost Performance Index) cost-effectiveness
If CPI = 0.80, this means that for every €1 spent, only €0.80 worth of work is actually produced (inefficiency)SPI (Schedule Performance Index) Measure the effectiveness of the planning
If SPI = 1.20, this means the project is ahead of schedule
General rules:
CPI < 1 → Over budget
CPI > 1 → Over budget
SPI < 1 → Retard
SPI > 1 → Advance
3. Application of EVM to real-world projects
Step-by-step methodology:
1. Establish a baseline (BAC – Budget At Completion)
Define the total budget and construct a time-phased cost plan.
2. Tracking progress (Earned Value – EV)
Measure the actual work performed against the planned scope.
3. Collect actual costs (Actual Cost – AC)
Track expenses in real time (labour, materials, overheads).
4. Analyse performance (CPI & SPI)
Compare EV, PV (Planned Value), and AC to evaluate project efficiency.
5. Forecast the final cost (Estimate At Completion – EAC)
Use EVM formulas to estimate the final cost:
👉 EAC = BAC / CPI (if future performance follows past trends)
4. Case Study: EVM in Practice (Infrastructure Project)
Scenario:
Motorway project £80 million, halfway through (6 months out of 12).
Project details
BAC: €80 million
Turnover: €40 million (€50 million planned for Q1–Q3)
Revenue: €36 million (€45.1 million achieved in Q3)
AC: €44 million (spending higher than planned)
Performance analysis
CPI = 36 / 44 = 0,82 cost inefficiency
SPI = 0.9 0,90 Hold or postpone planning
Final cost forecast
EAC = BAC / CPI = 80 / 0.82 = 97.56 M€
⚠️ ALERT: Estimated overrun of €17.56M without corrective action
Corrective actions:
Improve team productivity (increase CPI)
Reschedule non-critical tasks (retrieve SPI)
Implement cost optimisation measures
5. Challenges in implementing EVM in large projects
Despite its advantages, the EVM presents several challenges:
Resistance to change Difficult adoption by teams
Complexity of data collection Need reliable real-time data
Integration problems ERP, Primavera P6, cost tools
Past data dependency historical trends do not guarantee the future
Best practices for successful EVM
Train project teams in EVM fundamentals
Automate data collection (Primavera P6, SAP, Power BI)
Gain stakeholder buy-in
Use the EVM as an early warning system
Conclusion: Why the EVM remains a standard of excellence in Project Control
Earned value management remains one of the most powerful techniques in project control, as it allows:
An objective measure of performance
Proactive risk anticipation
Reliable and quantified forecasts
What challenges did you encounter in implementing the EVM?
How do you use it on your projects? Share your feedback.
 Français
  English (UK)
  Español
  Italiano
  Deutsch
  Nederlands